Lemmy.one
  • Communities
  • Create Post
  • heart
    Support Lemmy
  • search
    Search
  • Login
  • Sign Up
Agrajag@scribe.disroot.org to Climate - truthful information about climate, related activism and politics.@slrpnk.netEnglish · 1 day ago

From cattle to crayfish, human pressures mount on Zambia’s Kafue River

news.mongabay.com

external-link
message-square
0
fedilink
8
external-link

From cattle to crayfish, human pressures mount on Zambia’s Kafue River

news.mongabay.com

Agrajag@scribe.disroot.org to Climate - truthful information about climate, related activism and politics.@slrpnk.netEnglish · 1 day ago
message-square
0
fedilink
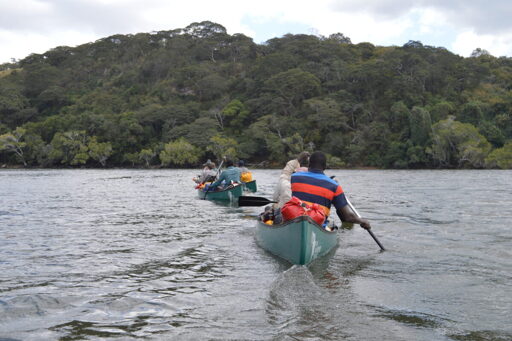
KAFUE, Zambia — “Three cattle on the left, 20 elephants on the right,” shouts the expedition leader from the bow seat of the first of five canoes snaking along a stretch of the Kafue River in central Zambia. The cattle are grazing near one of the many small farms and settlements that dot the river’s […]
alert-triangle
You must log in or # to comment.

Climate - truthful information about climate, related activism and politics.@slrpnk.net

climate@slrpnk.net

Subscribe from Remote Instance

Create a post
You are not logged in. However you can subscribe from another Fediverse account, for example Lemmy or Mastodon. To do this, paste the following into the search field of your instance: !climate@slrpnk.net

Discussion of climate, how it is changing, activism around that, the politics, and the energy systems change we need in order to stabilize things.

As a starting point, the burning of fossil fuels, and to a lesser extent deforestation and release of methane are responsible for the warming in recent decades: Graph of temperature as observed with significant warming, and simulated without added greenhouse gases and other anthropogentic changes, which shows no significant warming

How much each change to the atmosphere has warmed the world: IPCC AR6 Figure 2 - Thee bar charts: first chart: how much each gas has warmed the world.  About 1C of total warming.  Second chart:  about 1.5C of total warming from well-mixed greenhouse gases, offset by 0.4C of cooling from aerosols and negligible influence from changes to solar output, volcanoes, and internal variability.  Third chart: about 1.25C of warming from CO2, 0.5C from methane, and a bunch more in small quantities from other gases.  About 0.5C of cooling with large error bars from SO2.

Recommended actions to cut greenhouse gas emissions in the near future:

Anti-science, inactivism, and unsupported conspiracy theories are not ok here.

Visibility: Public
globe

This community can be federated to other instances and be posted/commented in by their users.

  • 316 users / day
  • 1.54K users / week
  • 3.67K users / month
  • 9.38K users / 6 months
  • 44 local subscribers
  • 6.93K subscribers
  • 9.43K Posts
  • 39.7K Comments
  • Modlog
  • mods:
  • silence7@slrpnk.net
  • BE: 0.19.7
  • Modlog
  • Legal
  • Instances
  • Docs
  • Code
  • join-lemmy.org