

You must log in or # to comment.
And with battery prices falling, the intermittency issues that made LNG useful despite the drawbacks is gradually becoming much less of a problem too.
Plus it’s pretty easy to simply shift the time of use to when there’s the most clean capacity online (and this is easily encouraged with variable electricity rates)
I wouldn’t say ‘easily’. I live in a country with a so-called ‘liberalized’ electricity market, and although I’m enough of a software developer to have custom scripts to pull the daily market hourly prices, I still wouldn’t call it easy to schedule around. And most people really don’t have the kind of options my expertise grants me.
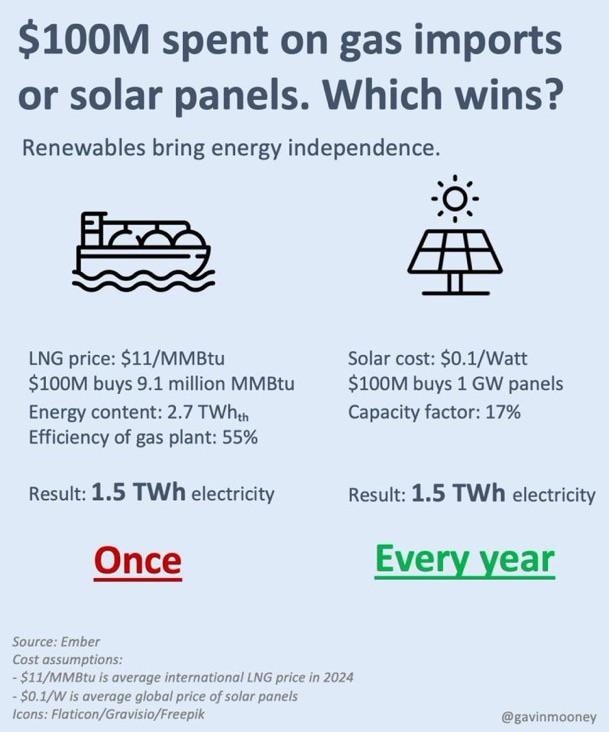
And this is 2024 numbers. Gas is more expensive now that the strait of Hormuz is closed for a good long time
This is dead wrong (edit: kind of; see below). The dollars per million BTU for natural gas this February was $3.62, or 32% of the figure cited in the infographic. You’re thinking of oil.
Solar is clearly more sustainable, economical, independent, and most importantly livable than LNG, but I still need to call out flawed assumptions on my side where I see them.
Edit: I actually have no idea how this infographic reached its $11 assumption. Wholesale prices for natural gas were $4.88 per MMBtu in 2024. Emphasis on “wholesale”, but since this infographic doesn’t deign to cite any sources other than “Ember” (this Ember?), I have no idea what figure it means.
Edit 2: After doing way too much digging into how global LNG prices are measured because this infographic barely even leaves breadcrumbs, they might’ve been using a metric like the JKMc1 (“LNG Japan/Korea Marker PLATTS Future”) (edit 3: or the TFAc1). The prices of natural gas (transported via pipeline) and LNG (transported via ship) are going to be quite different, and there’s no consistent “global average price” for LNG. The best you can really do is use some sort of proxy, for which it appears the JKMc1 is a reasonable one for reasons I don’t fully understand yet. That was approximately $11 in 2024 (it was actually seemingly higher, but close enough; probably close but separate figures) and was $10.73 this February. It was $15.92 March 1, showing at least in East Asia that LNG is about 50% more expensive than last month. I don’t know how well that applies to Lemmy’s predominantly American and European userbase, however (well, I know the US now supplies about 60% of Europe’s LNG and that American natural gas is currently cheaper).
God, it’s so frustrating that this infographic barely cites anything. Anyway, to the person I responded to: you were at least somewhat right; the closing of the Strait seems to have clearly impacted East Asia… somehow. Iran and Qatar are the 3rd and 6th largest natural gas producers, respectively (no clue about LNG shipments), but I feel like I’ll end up with a doctoral thesis on the geopolitics of LNG prices by 2030 from knowing basically nothing if I don’t stop here. What all this does tell me is that an estimate of “global average price for LNG” means very little when prices per MMBtu (liquified or otherwise) seem to vary so heavily by region.
It’s probably just AI generated bs.
Generally, solar takes 10+ years to break even in a residential situation, I can’t see how things would be 10x cheaper at the TWh scale.
I don’t agree with the “AI-generated” claim. Gavin Mooney appears to be a real person working with Kaluza, an Australian company which presents itself as:
The Energy Intelligence Platform
An electrified future will be built on data intelligence.
We turn energy complexity into growth opportunity so energy companies can make a cleaner, smarter system work for everyone.
(So a financial conflict of interest, but one I happen to agree with.) I just attribute it to a “shitty, token attempt at sourcing because nobody really checks these things” mindset.
When energy prices went crazy in the UK a while back I heard of some people getting under a year payback times. My energy usage is much lower than theirs so it would take me quite a bit longer though. A lot of the costs are fairly static.
At this point a battery alone might be a better investment. Cheaper install and using off peak rates to charge could drop my per unit costs from 24 to 8. But I think even that would take years to pay for myself. It’s also annoying because the grid should already be fucking doing this! Why should I have to do it myself in a setup that is going to be far less efficient in costs than doing it at grid scales with bulk buying of batteries?
The tech exists today, I can buy it.
Economies of scale
Maybe.
I can’t find any gavinmooney profiles on any socials… even x dot com.
For DYI plug-in small scale solar and meter running backwards (balkonkraftwerk scenario) for 0.3 eur/kWh break even is less than 2 years.
DYI larger/meter not running backwards but with battery buffering it’s longer. Anything else requires a licensed electrician, and that does set you back.
The infographic is using 10c/watt as solar panel only. Your 10 year payback is based on tariffs, permits, sales comissions, and a monopoly utility designed to make solar prohibitive. In Australia, payback is about 2 years. But, yes, at utility scale the lack of BS costs make a giant difference. Under $1/watt installed instead of $3+/watt.
this right here is the only reason I’m still skeptical of pretty much everything
promoters of green and nuclear energy can’t get their damn act together and create proper articles that aren’t half-assed crap with no sources. They just claim shit from thin air.
Bitch, I WANT to believe you! Give me something to bloody believe that we really have no reason to use fossil fuels anymore.
I still
kindabelieve it. But CONVINCE ME ALREADY…It’s funny you assume they have to convince you.
We know already about climate change, we know already about geopolitics and sovereignty issues, we know fossil fuels are a finite resource, which means they’ll inevitably get more expensive over time as we run through the most accessible deposit and go to ones that are harder and harder to harvest.
But you think they should convince you to use renewable, and not the other way around: why would you want to stick to fossil fuels? Name your argument and back it with solid sources, please!
I don’t have one and I’m in favor of every renewable + nuclear
I think using fossil fuels increases dependence on other countries like the
southmiddle east, which both causes instability in those regions, and makes us vulnerable to them.Though you are right about how fossil fuels will become more expensive eventually, we’ve been finding more coal and oil deposits than we have been depleting… At least according to like an hour of research I did a while ago. It’s close, but I don’t think we will be running out soon.
Though the ozone layer is healing specifically because we cut back on that shit.
My point was - why fucking make shit up and lie in favor of renewables and nuclear? Why not quote proper sources? There’s plenty of positives to renewables but man, some of these writers are incompetent.
In Yankee places “gas” means “gasoline” so I’d blame the infographic for saying “gas imports” instead of “natural gas imports” if it’s supposed to target the country that uses the most natural gas
I don’t blame it whatsoever for calling it “gas”; it should be clear to anyone remotely familiar enough with energy infrastructure to understand anything past “solar better”, i.e. they should at least pick up on one of the following (in no particular order):
- Gasoline and solar power would only be comparable for cars, and the comparison would be nonsense because electric cars pull from the grid, not pure solar.
- The icon on the left is distinctly an LNG tanker. Even if you’ve never seen one, anyone who’s seen a crude oil tanker would know it looks nothing like that.
- The graphic explicitly says “LNG” twice.
- Measuring gasoline in MMBtu would be deranged for this comparison; the sale price is expressed in the volume of crude oil/gasoline, so you’d just convert it straight to Watts. Even if you didn’t know what a Btu is, you’d at least think “what the fuck is an MMBtu?”
- Cars are never mentioned once.
- One of the statistics is “Efficiency of a gas plant”, which is the nail in the coffin for anyone who understands literally anything about energy.
At some point it’s incumbent on the reader to have a bare minimum understanding of how the world around them works; I learned some of this in circa sixth grade. Some of this on its own isn’t common knowledge; all of this taken together should stop any reasonable reader from defaulting to “gasoline”.
If you’re just gleaning it in a hurry, you miss the relatively fine print from “LNG” to “55%”. Selecting font sizes to emphasize the most important information, and being understandable by an uninformed audience base (think social media), is absolutely fundamental to infographics.
the comparison would be nonsense because electric cars pull from the grid, not pure solar.
Not necessarily. Quite a lot of solar installation companies like Tesla’s popular roof-like tiles push self-sufficiency for some reason. My guess is to sell batteries. Anyways, even without that, your petrol bill’s still a useful visualization for how much more economic solar is
anyone who’s seen a crude oil tanker
MMBtu
gas plant
Buddy, I obviously agree for MMBtu, which is why I cited it among other unordered points and explicitly called out that people are liable not to know it. If you do know it, though, it immediately gives it away, which is why I included it to cover bases.
But a crude oil tanker is a common thing plenty of people have seen, and putting “power plant” in there is straight-up a self-own: you are profoundly ignorant about energy infrastructure if you think we’re taking gasoline into power plants to convert into electricity. That doesn’t make someone bad or stupid; it just means they have zero standing to complain about how an energy infographic misled them by calling methane “gas”. They lack the bare minimum foundation to even understand what it’s trying to say.
It should also be obvious that when I said “not pure solar”, I meant “generally”, because at that point the reader would need to be willfully obtuse to construe the graphic to be about electric cars. I almost hedged with “generally”, but I (wrongly, naïvely) assumed it wouldn’t be subjected to superfluous pedantry.
Edit: I actually forgot another obvious point because there are just so many things that would tell reasonable people this isn’t about gasoline: why would a tanker be used as an icon to represent gasoline anyway? A jerrycan, an oil barrel, or a gas pump would clearly be much better, because oil tankers don’t represent the final product anyway, aren’t a common icon for gasoline (if basically at all), and don’t have a distinctive side profile. There are a million reasons it’s not the graphic’s fault if you look at it and assume it’s about gasoline.
Not everyone lives in oceanside windows. Out of those who have looked at one they don’t necessarily know that’s an oil tanker; if it’s through a beach, it’s too distant (and likely heatwaved) to perceive something different with the deck at first sight, and at closer ranges I used to think they were just empty cargo ships “and of course the decks are so high up because the ship is floating higher up because it’s lighter”. Working with content who’ve never been on a ship they think there’s nothing beneath the deck except what makes it float.
There’s also the assumption that one wouldn’t think “it’s probably a different kind of oil tanker I haven’t seen since it ‘obviously’ says gasoline”. “What the fuck is an MMBtu?” Something related to gasoline, of course. Hindsight is not first sight.
Most US people are profoundly ignorant about energy infrastructure other than coal plants exist and the US relies on fossil fuels and you put petrol in your car. Just because you remember a great education doesn’t mean others remember their bad education. Ask someone outside of the energy and environmental subject what they learned in Earth Science (sorry if I got the subject name wrong) other than the different types of rocks, tectonics, and what the weather really is.
it just means they have zero standing to complain
An infographic’s purpose is to communicate to the uninitiated, not preach to the choir. This is just a single word that artificially limits its target audience and frankly I don’t see why we’re arguing so pointedly about it.
the reader would need to be willfully obtuse to construe the graphic to be about electric cars
I didn’t think it was about cars either, but I still think it’s plausible enough that one in a hundred could mistake it, and that is my point.
P.S.: Kudos for the diaeresis.
Europe is currently over $15/mmbtu. Your prices are not for LNG which is what Europe or Asia is faced with importing.
good time to plug the technology connections video
When is it ever a bad time?
good time to plug the technology connections video
good time to plug the technology connections video
good time to plug the technology connections video
I missed it when it made the rounds a few weeks back. Thanks for sharing again!
How do I vote him in as president?
We need a fricken youtuber to say what the bought and paid for media is too afraid and cowardly to say. Why can we not have someone like this as a politician! Well, because he’s actually smart, he wouldn’t take that job.
What do the lobbyists get out of the solar panels? How do the solar panels generate constant fees?
How do the solar panels generate constant fees?
You see, people need to pay for electricity. Generally speaking, they don’t get it for free. Thus the owner of the solar panels makes money.
The issue with solar is, that the owner can be a simple home owner putting the panels on their roof. When you add batteries to that, it is entirly possible that they never need to buy electricity from the grid ever again. However we are still talking about some middle class person here, who is not going to be able to afford a lobbyist.
There are other ways well below lobbyist level as well, such a solar and wind cooperatives or some farmer setting up a few installations on his property. They do have more money, but still probably are well below lobbyist levels of money.
Considering that US congressmen can evidently be bought with like ten to twenty thousand bucks, or tickets to some resort, I don’t understand how USians still don’t have crowdfunded lobbying.
Because it would make it way too obvious that their representative are not really representing voters but only the biggest wallet around. Second is a crowdfunded lobbying would be a one shot thing, while corporate lobbying can provide a more stable “support”.
Right, so before we see solar take hold, it needs to be illegal for a property owner to own the panels, and the power company has the right to put them anywhere they like.
In sweden its set up so that the owners of household solar cannot ever make money, only save on cost
what the fuck?
Gotta pay for grid maintenance somehow
Same in most countries. In the U.S. many states penalize people for putting in solar through forced monthly payments to the power companies even if they use zero KWh.
This is what happens in the area I was looking to move to… at that point I’d just have myself removed from the grid entirely. Fuck that nonsense.
Right. There’s not as much money in renewables, so there’s less lobbying.
I mean… Isn’t there though? You do a one time investment, and then you earn money for 20 years with negligible operating costs.
Shouldn’t every capitalist get a priapism from this idea?
Capitalism is about hierarchy more than it is about profit. Capitalists spent billions to put someone who bankrupted a casino in charge of largest economy in the world to stop the woke left. Capitalists pay for golden parachutes for nepo baby CEOs who shit the company bed. Capitalists sack departments with mission-critical institutional knowledge because that institutional knowledge gives the workers power.
In an ideal free market, the company that ends up with the largest market share is not the company that optimized for profit, but the company that optimized for murdering all the other companies so it’s the largest by default. In real life, the rich and powerful let this mechanism roam free when it helps them oppress the working class, while regulating the market when it makes the game unfun for the rich, and while insulating each other from the consequences that were not guarded against by regulation.
I think the main problem is a lot of them are already entrenched in the fossil fuel market and most of the people holding the money aren’t the entrepreneurial types because all the wealth is inherited so they’d rather just hold onto their existing property and fight to keep it relevant than start again somewhere else. It’s dumb though because yeah it’s free money printing. Am I assessing this right?
Not a fair comparison.
In a nutshell, you can’t directly replace gas power with electric power. Gotta have some sort of conversion. Gas is very portable and offers big bang. Solar generally needs to be generated on demand or stored. Then it needs to be transported. We can’t transport the solar power from Texas to Michigan the same way we can truck gas across state lines. The longer an electric line, the more power is lost.
Another issue with this graphic is that it implies that solar panels are a one-time expense. This isn’t true. They generally last about 20 years.
I’m a champion of green energy, but a stickler for details.
Then as a stickler you should probably clarify that 20yrs isn’t the lifespan of a panel but the simply the end of most warranty periods.
The panel itself is (typically) fine, just less efficient after so long.
Solar panels are easily recyclable as are a lot of batteries once infrastructure catches up. You burn that gas and its gone.
Millions of acres are used for corn to produce ethanol mixes for gas. All of this land is under direct sun. Also wind. This again is because of corn subsidies in the US.
The amount of money tied up in oil companies is second only to the military industrial complex. If we took that money to put toward renewable, we would solve a shit ton of issues.
Yes voltage drop exists. However , you know we have electrical lines to basically every structure in the US right? Even Joe blow in the absolute middle of nowhere has power lines. The grid is already here. We need to invest in it and improve it (also destroy data centers but thats a different discussion)
Also, panels dont just abruptly die after 20 years. They slowly start losing efficiency. You could be using a 30 year old panel, and it could be at 70% efficiency depending on degradation (*I can’t say if 70% is accurate , I’d have to research it). Again, gas is burned up and used instantly, one time. Panel gets old, recycle it.
But we don’t do things because they’re good. We do them because they’re profitable. Capitalism breeds innovation right?
Solar panels are easily recyclable
What’s the source on this? To my knowledge they’re like most e-waste: technically recyclable but separating the component elements is functionally impossible
Most of the mass is aluminum for the frame. Then you have the actual silicon, which are paper thin wafers. And a voltage controller.
Also, its moot anyway, because that gas and oil is burned up the second its used. If we even recycle the frame of the panels only, net win.
separating the component elements is functionally impossible
No, it’s actually easy to pull apart the different components of a panel and can be done by hand. The main expense is the labour.
The labor cost is the problem - it costs $10 to $20 (AU) to recycle a panel, but the value of the parts vary based on the cost of copper, silver and aluminium and so capitalism struggles to make a consistent profit on it. Hopefully as the oil crisis worsens, transport costs will probably go up and the profitablity of recycling should increase.
The beauty of solar though is its pretty deployable to where the demand is, especially rooftop solar with residential batteries.
We can’t transport the solar power from Texas to Michigan the same way we can truck gas across state lines.
Batteries?
Also this is goofy. Panels aren’t centralized. You could have tons of panels and wind in Michigan. You wouldn’t transmit Texas power that far unless you really had to, and there’s still ways to do it if you needed
So, driving batteries around the country? Really?
I mean no, because it probably wouldn’t ever need to be done.
But I’m not sure why it would be any worse than trucks full of oil.
It wouldn’t be done because the energy density of a battery is atrocious compared to oil, something like 100x worse. Half of the input spent in burning oil comes for free in the air around us, so batteries will never likely beat it.
it probably wouldn’t ever need to be done.
As the parent commenter said, the energy itself wouldn’t need to be delivered. You just deliver the panels once.
Why be just as bad as the old system? And while I’m not sure, I would expect it would be hugely more inefficient in terms of energy produced compared to energy delivered to the end user.
Bud, we drive gas around the country. Thats even stupider.
Lot of propaganda from oil companies is working, I see.
Yeah, I know. That’s why driving electrons around the country isn’t any better.
You don’t need to drive electrons around constantly - just drive the panels there once and you have power there for 20 years.
Michigan is cloudy or overcast most of the winter. It’s a lake-effect thing, it starts once you get over the border from Indiana. Why use panels 4 or 5 months out of the year?
I had Google help me out with this one. For illustrative purposes, let’s take the Tesla Semi (an electric commercial truck) battery. You could transport about 4 MWh worth of electricity. That’s about 4 months worth of electricity for an average American household. Here’s the details:
A single Tesla Semi utilizes an estimated 850 kWh to 1,000 kWh battery pack, which weighs approximately 10,000 to 12,000 lbs. If a trailer were filled strictly with these large, fully integrated packs rather than smaller, individual battery cells, only about 4 to 6 of these high-capacity, 1-megawatt-hour systems could physically fit within the weight limits of a standard trailer.
Battery Capacity & Weight: The Semi uses roughly 1 MWh, which consists of four, high-capacity, smaller packs.
Total Weight: A full 1 MWh pack weighs between 10,000 lbs (4,570 kg) and 12,000 lbs.
Capacity Limit: Due to weight restrictions of 80,000 lbs for a loaded semi (with a 2,000 lb increase for EVs), you cannot simply load 80,000 lbs of batteries into a trailer.
Physical Space: While the trailer has massive volume, the 10,000+ lb per pack weight means the trailer would reach its weight limit long before it is full of, say, Model S packs (if that was the method).
Now compare that to high voltage power lines if you’re interested. “HVDC transmission losses are quoted at 3.5% per 1,000 km (620 mi)” (Wikipedia)
deleted by creator
Then use the next $100M for developing energy storage infrastructure… Or split the upfront cost evenly between generation/storage. Gotta think longer term than a single years’s balance sheet. Anything you build now saves you money in the future instead of shoveling it into a literal incinerator.
Woah there you socialist, we only care about next quarter profits here !
/s
Thank you for the sanity. Transmission and distribution loss is a problem, as well as sending power doesn’t even work like that. You can’t tell power where to go in a grid, you just put power in to the system. Trying to shuffle power from the Texas grid across a couple subregions to MI would be bonkers. It would be easier to operate 200 SMRs in MI.
If you’re interested, modern HVDC transmission is really efficient on long distances. “HVDC transmission losses are quoted at 3.5% per 1,000 km (620 mi)” (Wikipedia)
One of the more interesting things I’ve learned is that the reason why electricity is so cheap at night is because it’s hard to properly throttle fossil fuel plants.
Depends on the type. Coal takes hours to ramp up to temperature but combined-cycle gas turbines ramp up and down in minutes.
The basic statement is that $100m is spent once and is gone or it is spent on a recurring resource. Seems to clear, all the arguments about the evils of solar panels are ignoring that the bill is$100m or $20,000m over 20 years. For a $20b saving, people should be able to afford a few changes. I have.
Wrong details though. You sound like you WANT to be dependent on fossil fuels. And calling yourself a “champion of green energy” reveals quite a lot. 🤷
There are other expenses and location also plays a big role, but it is certainly true that solar is much cheaper when all is said and done. Hence why the energy transition continues in the US even without subsidies.
my solar panels don’t produce shit because my city never sees the sun.
The Short Answer
Low clouds can block light from the sun, which means less solar energy. However, certain cloudy conditions can actually increase the amount of light reaching solar panels. Weather satellites such as those in the GOES-R Series keep an eye on these clouds, which can help scientists make predictions about the capture of solar energy.
https://www.nesdis.noaa.gov/about/k-12-education/atmosphere/how-do-clouds-affect-solar-energy
This is a straight up lie.
No, they are telling the truth. Solar panels do not need to poop.
Fuck. Ive been had.
deleted by creator
Do you live in Menzoberranzan?
deleted by creator
A) only one of those technologies is burning the planet… kinda big part of the equation
B) here are the numbers for australia:

source: https://www.csiro.au/en/research/technology-space/energy/Electricity-transition/GenCost
C) see A
Agreed. A more telling graph would incorporate socialized losses, including subsidies, life-and-limb for related industries, quality of life, and life expectancy. I sincerely doubt these costs for the construction, manufacture, and installation of solar panels comes anywhere close to that of petroleum products.
I don’t know, man. What if its cloudy?
Me shouting the answer, but you can’t hear it over the bombs exploding across the Straight of Hormuz
You can use batterys
I mean yes, but also then the investment gets a lot bigger too.
In my country (Estonia), if we did solar + batteries only, the batteries would have to be large enough to withstand electricity consumption being smaller than production for the entire summer (which at its peak has 18 or 19 hours of sunlight per day and most people don’t have AC so our summer electricity usage is smaller than winter).
And also from about october to march, there’s almost no sunlight, and electricity consumption is through the roof because heat pumps have been pretty common in new builds and renovations for like 2 decades now, replacing mostly solid fuel furnaces rather than resistive electric heaters.
Which is not to say we should abandon solar, but it’d be incredibly cost-prohibitive to go renewables-only here. In the summer our electricity prices often go negative already (still zero + network fees for consumers, not really negative prices -.-), but in winter I’ve seen 5 euros per kilowatthour at peak times.
Now I googled the cost of a terawatt hour of battery capacity and Google’s AI was happy to report to me that a terawatthour is a million kilowatt hours and thus at ~80€/kWh it would be 80 million euros. That’s peanuts! Just 640 million would get us enough battery capacity to store a year’s worth of energy, that should surely get through a winter!
Trouble is, I was taught slightly different values for the SI prefixes and back when I went to school, tera was a billion kilos. So if it still functions that way, we’re talking hundreds of billions instead. Our national budget for the year is 20 billion. But if every person with a job paid just a million extra euros in tax, we could afford to do it!
So obviously, solar alone + batteries won’t do it at such a high latitude. Wind power helps a ton, but that’s still unpredictable. And after everyone on a flexible-price plan saw a 5x increase on their power bill for january (1000+ euros being pretty common), I don’t think the people will settle for “works most of the time”. We actually need a nuclear power plant and we need it to be built before December 2025.
Till then we’ll continue burning dirty ass coal and (yay, even worse) shale. Which I fucking hate, but the economic reality of our country is that this is what we can afford right now, with a gradual buildout of solar + wind.
But funnily enough, if we got the hundreds of billions worth of batteries magically out of thin air, the cost of buying enough solar panels to produce the entire country’s annual electricity consumption every year… Would be in the hundreds of millions range or a bit over a billion at most if this meme/infographic is to be believed, even if adjusting the capacity factor, which is more like 10-15% here due to our nasty winter. Chump change pretty much for a country like ours.
This is the funny AI response that says both millions and billions for the cost of a terawatt hour of battery capacity. For my own calculations I actually went to the source at Bloomberg and took a number that was on the lower side, but not the minimum, of the range they provided for 2024.

I don’t think we have to worry about AI developing the I part of AI anytime soon.
Also, in 2024 we roughly doubled our peak solar output from 600 MW to 1300 MW! (2025 unfortunately saw a LOT less new solar installation).
But our winter peak consumption is 1600 GW, so this is still a bit under 0.1% of that. And peak production is in the summer :/
You don’t need 1twh of batteries to support 1gw of solar you need 2-4gwh depending on wanting 2 or 4 hours of overnight storage. Prices are dropping so fast, or so low now, that 6 hours is an easy option to choose. But for winter, see my other post on H2, or just don’t nuke your legacy power from orbit, and keep them as backup/battery equivalent.
You don’t need 1twh of batteries to support 1gw of solar you need 2-4gwh depending on wanting 2 or 4 hours of overnight storage
At the present state of things, you’re definitely right.
I’m talking about winter, where you can count on solar panels producing… nearly nothing.
This is a company here in Estonia sharing customers’ monthly production numbers. This is a company trying to sell you solar installations, so they have no reason to show any numbers as lower than reality. I clicked through several customer experience pages, and most have ~30x less energy generated in December vs May.
The Nebraska comparison in your other reply to me doesn’t work out because Nebraska is way further south. In December, the sun doesn’t “rise” here as much as it “drags its’ rotting carcass across the horizon”. Okay, we’re not as far north as something like Svalbard, but the angle of the sun during solar noon on December 21 (shortest day of the year in the northern hemisphere) is around 7 degrees. In Nebraska it stays around 25 degrees. While we technically get up to 6 hours of daytime even in December, it’s usually overcast so average sunshine per day is about 30 minutes over the winter. And if it’s not overcast, you can expect it to get cold fast, driving up usage.
So to go full solar (which I’m discussing as a thought experiment, I don’t actually know anyone who wants to go FULL solar), essentially all the energy needs to be generated in about 7-8 months each year, because once the days start getting shorter, they go short REALLY fast. That’s going to be a lot of H2 to store.
or just don’t nuke your legacy power from orbit, and keep them as backup/battery equivalent.
That’s a reasonable suggestion, it’s just that we’re not burning anything clean like coal here, we’re burning shale. It’s comparable to lignite (if not worse) in CO2, but way more ash. Yes, shale the actual rock, not shale gas.
It’s super frustrating.
most have ~30x less energy generated in December vs May.
Believable for shallow roof angles. Steep angles make a large difference, but it’s still definitely a challenge for winter peak demand, and huge summer surpluses.
In Estonia vs Nebraska, 1000 wh/watt/year vs 1800 is a signficant disadvantage, and as you say, December averages 15 minutes/day of solar energy.
I did pick Nebraska for relatively north and sunny location, with ethanol substitute land use. It has 9-10x Estonia’s winter production, and so Estonia definitely seems like a shithole solar location.
The H2 system still works for Estonia. I made this for you:
This report outlines the technical and financial feasibility of a self-sustaining
125 kW Solar / 90 kW Electrolysis microgrid in Estonia. Optimized for the high-latitude constraints of the Baltics, this system leverages a summer hydrogen surplus to subsidize a 24/7/365 1 kW baseload datacenter requirement.
1. Core System Configuration
- Solar Array: 125 kW DC (Sized to achieve the “Zero-Cost” revenue break-even).
- Electrolyzer: 90 kW (Sized to swallow 72% of peak solar yield, minimizing battery-to-hydrogen conversion losses).
- LFP Battery: 185 kWh (Optimized for a 7.7-day “dark-start” winter survival buffer).
- Baseload Load: 1 kW constant (8,760 kWh/year).
2. Financial & Cost Assumptions
- Financing: 5% annual interest over a 25-year term ($88.58/year per $1,000 CapEx).
- Western Premium: 35% markup on base Chinese hardware for logistics, EU import duties, and local Estonian labor/permitting.
- Hardware Pricing (Installed):
- Solar: $0.47/Watt ($59,062 total)
- Electrolyzer + BoS: $675/kW ($60,750 total)
- LFP Batteries: $108/kWh ($19,980 total)
- Annual O&M: 1% of total CapEx ($1,397/year).
3. Annual Capital & Operating Expense
Expense Category Amount (USD) Total System CapEx $139,792 Annual Debt Service (5%) $12,383 Annual O&M (1%) $1,397 Total Annual Cost (A) $13,780
4. Energy Production & Hydrogen Revenue
Estonia receives ~950 Peak Sun Hours (PSH) annually. The 125 kW array generates ~118,750 kWh/year. After accounting for the 1 kW baseload (8,760 kWh), the remaining ~110,000 kWh is directed to the 90 kW electrolyzer.
- Annual Hydrogen Production: ~6,890 kg H₂ (assuming 16 kWh/kg system efficiency).
- Hydrogen Revenue (@ $2/kg): $13,780 (B)
- Net Cost of Baseload (A - B): $0.00 / year
- Effective Electricity Rate: $0.00 / kWh
5. Winter Reliability Analysis (The “Dark-Month” Stress Test)
Unlike the Nebraska model, the Estonia configuration faces extreme seasonal variance.
-
Average December Yield: ~30–35 kWh/day (Enough to cover the 24 kWh/day baseload).
-
Worst-Case “Deep Cloud” Day: ~6–8 kWh/day (
 0.05--0.07 PSH
).
-
The Survival Buffer:
- With a 185 kWh battery, the system provides 185 hours (7.7 days) of 100% autonomy for the 1 kW load with zero solar input.
- If the array yields even 7.5 minutes of “sun hours” (as discussed), the daily deficit drops, extending the buffer to ~12 days.
-
Operational Status: The 90 kW electrolyzer will be completely offline from late October to early March, as all available photons are prioritized for battery health and the 1 kW load.
6. Conclusion: The “Latitude Tax” Equilibrium
This system represents the Saturation Point for Estonia at $2/kg Hydrogen.
- The Win: You have successfully engineered a system where the 1 kW datacenter load is powered for free, as H₂ revenue exactly offsets the $13,780 annual debt and maintenance.
- The Limit: Adding more solar/electrolysis at this latitude would result in a net loss, as the incremental debt ($42.50/kW) exceeds the incremental revenue ($34.40/kW).
Does the wind not blow in Estonia?
Conveniently stops blowing when it’s cold and electricity demand skyrockets, or at least that’s the excuse they give for why the prices shoot to the moon.
There’s also at least one major shale power plant in repair every time it gets proper cold lmao
analysis for Nebraska that would apply for Estonia or Canada as well with only a few parameters changed. Free 24/7 baseload solar electricity if Hydrogen can be sold for $2/kg (equivalent to 25c/liter gasoline in range). https://lemmy.ca/post/59615631
Nebraska actually gets like 5-10x the useable solar power in the winter months compared to Estonia. We essentially don’t see the sun from about nov to mid feb.
All of the H2 would have to be generated between spring and fall and stored for winter. Selling it and then buying it on-demand in the winter wouldn’t work because fuels shoot up in price come winter. Cost of my wood briquettes tripled between July last year and February this year for an example, usually it at least doubles… And once I’ve seen them quadruple. Luckily it’s a single house worth of solid fuel, it’s easy to stockpile. I’m wondering how a couple of terawatthours worth of H2 storage would work.
To be clear, I’m not at all against solar or renewables in general, I just don’t see any energy storage solutions that would work for my country if we tried to fix our shit as a nation. On an individual level it’s doable, but payoff period is so long that it makes more sense to just keep using grid power.
analysis I replied with didn’t require a separate heating solution, though heating 1000l or 2 of hot water in fall would be a great strategy for every home heating system. The reason H2 electrolysis (just sell it instead of using it for heat in winter, though that is also a solution) works even for “your solar shithole country” is the massive summer daylight. No H2 produced outside of the good months.
The issue with the H2 solution is that we still need electricity in the winter, especially as more heating is done with electricity than ever before. If you don’t store it in the summer, you’ll be buying it from other countries at 10-50x the summer price oftentimes.
The analysis I’m presenting provides 1kw or 1600mw of continuous 24/7 power at 0 electricity cost including 5% financing costs. Showing that this works in one of the most hostile places for winter solar in the world.
There are indeed a lot of practicalities that can improve upon this. Summer demand is typically 1/2 of winter peak demand. The H2 electrolysis system is there purely to monetize all electricity generated at 4c/kwh. Selling the massive summer surplus at 4c/kwh or more makes more money than H2. Selling the “free baseload” for anything at all makes money, or selling H2 for more than $2/kg.
Wholesale rates in estonia/regional market are 15c/kwh in winter. The model to provide 1600mw baseload takes about 200gw of solar (125kw per kw baseload), that still provides surpluses on average winter day, before accounting for less than 24/7 of peak usage, diverting heat to fall storage systems, using wind instead of all solar, trade with less hostile solar regions bidirectionally/seasonally, use EVs as even bigger battery buffer.
For one, the 1600mw peak isn’t as relevant as the 27gwh/day peak = 1100mwh/hour baseload covered by battery = up to 30% smaller system. But even with original large system, there would be 10-20gwh/day in winter available to be sold at up to 15c/kwh profit. $1.5-$3M/day. The giant size of the solar would mean that electricity rates are 4c/kwh everywhere else in the region in other seasons, and H2 system is still needed to ensure 4c/kwh monetization even as it lowers rates everywhere around them. ie. a system this big forces permanent 4c/kwh wholesale electricity anywhere it can trade to for 3 seasons.
Even if there are much more profitable locations for solar than Estonia, the high cost of transmission still makes local systems pay off. Transmission links are a resilience option that is actually more expensive than more local solar, but pays off when neighbours don’t adopt solar. OTOH, very small transmission lines work well with battery systems in that they can be trickle imported at 24 hour rate in anticipation of weather/demand/battery charge level rather than as a response to instant supply/demand imbalance surge.
Trouble is, I was taught slightly different values for the SI prefixes and back when I went to school, tera was a billion kilos. So if it still functions that way, we’re talking hundreds of billions instead. Our national budget for the year is 20 billion. But if every person with a job paid just a million extra euros in tax, we could afford to do it!
Not sure if you were taught wrong or misremembering, but giga is the standard notation for billion, and tera is trillion. Kilo, mega, giga, tera,
quad, quin, peta, exa… They go on much farther than that, but at that point, just use exponential notation.E: wrong notation form
If tera is trillion and kilo is thousand, tera is a billion times kilo.
I don’t remember quad or quin, we had peta and exa here.
Derp, I knew that too.
If it’s cloudy, grains don’t grow and you starve.
Look at flowers and talk to people until it’s sunny?
You can generate hydrogen from electrolysis.
Electrolysis efficiency is about 70% and you can store the hydrogen in pressurized underground caverns for a year or longer using another 0.12 kWh per kWh of hydrogen stored, which makes a total efficiency of around 0.6 kWh of hydrogen generation and storage for every kWh of electricity that you put in. (Source)
So if your electricity costs 6 ct/kWh (current LCOE of solar in many places), then hydrogen is gonna cost 10 ct/kWh to generate and store with current technology.
Currently, natural gas is around 5 ct/kWh, so solar would have to become a little bit cheaper to make it economically competitive.
Edit: to clarify, the 5 ct/kWh for natural gas is the gas alone; electricity from natural gas is more expensive than that (around 12 ct/kWh) and more expensive than solar.
What are you going to store hydrogen in to make this remotely viable? You lose like 60% of hydrogen within 7 days with current tanks and seals.
The new sodium batteries make this completely pointless from a cost and efficiency context
Hydrogen can be stored for years.
Hydrogen’s small molecular size facilitates permeation through many conventional materials, leading to leakage and potential embrittlement of metals. These characteristics create “unique” (read: expensive) engineering challenges.
And if you store it as a liquid that’s when you enter the whole cryogenic problem, seeing it needs to be cooled to over - 225c
Even with advanced insulation, liquid hydrogen storage experiences unavoidable boil-off at rates of 0.3-3% per day, creating both economic and safety challenges.
And if you could make hydrogen via electrolysis, even with some uber wunderful unobtanium catalyst then you’re still just waiting electricity that we can store far more efficiently in batteries (and with sodium batteries hitting the market there is going to be a huge revolution in battery economics and tech that will make lithium look like a drop in the ocean.
The problems are mostly solved already. You wouldn’t use metals known for hydrogen embrittlement. Often times, you’d use something else, like HDPE or fiberglass that avoids this issue. Storage facilities can even be naturally occurring geological features, like salt caverns.
You would only use LH2 for specific cases, specifically where you are expected to use up the hydrogen quickly. But even this is changing, as self-refrigerating systems are being developed, allowing for very long-term LH2 storage.
We already can make hydrogen via electrolysis. This is a long-solved problem. Efficiency is not that relevant. The main limitation of batteries is that you simply cannot make enough of them. There are huge resource limitation problems. Meanwhile, hydrogen can be made from water and is effectively unlimited as a resource.
That sounds cheaper than battery storage (which at latitudes bigger than yours can get very expensive since there’s little to no sun in the winter), and I’d assume more environmentally friendly than mining all that lithium as well.
How expensive is it to build out said caverns for this use, particularly if there aren’t many natural ones available?
basically the caverns that are being considered/used for this are the same caverns that natural gas was extracted out of in the first place … they clearly held some sort of gas fine for millions of years, so certainly they’re gonna store a bit of hydrogen too.
they clearly held some sort of gas fine for millions of years, so certainly they’re gonna store a bit of hydrogen too.
Not to rain on your parade, but hydrogen and natural gas aren’t really comparable for storage. The natgas molecule is 8x heavier and MUCH larger than a molecule of hydrogen. Just on the size alone, hydrogen can slip through just about everything and needs to be stored at cryogenic temperatures. I don’t think rock is going to be as good of a storage media as you’d assume.
sure it’s gonna leak but if the rate of leakage is slow enough, you can ignore it :)
Oh that makes sense.
We just don’t have any natural gas production in Estonia lol. Perhaps the shale mines could be used. Unfortunately the biggest one had its permit extended till 2049 recently. Also I think they get filled with water naturally (they pump out a lot of dirty water), so I suppose the walls aren’t actually completely sealed naturally.
yeah, geological availability might vary
is home hydrogen a thing? i was wondering before, if it works in cars, why is it not in houses?
hydrogen scales well if you use big industrial setups, both for generation and for storage.
basically, bigger tanks are cheaper (consider higher volume/surface area ratio) and in fact the best tanks might simply be naturally occurring underground caverns. you can’t have these at home.
Technically it could work. However, traditional batteries make a lot more sense. Hydrogen makes some sense for a vehicle because it can be more energy dense (it actually only makes sense for large trucks). However, it has to be stored at cryogenic temperatures. In a place where you probably don’t care about mass or space much, other battery technologies are far better, without the added cost of cryogenic cooling and having to deal with hydrogen, which leaks through anything.
You would store it as a pressurized gas in this scenario. You would only use liquid hydrogen in specific situations.
Hydrogen gas is really hard to store. It is tiny, so it’s basically always leaking, no matter how good your seal is.
Underground caverns can store it for years. This is simply not true.
What do you mean it isn’t true? It’s a well known fact. It’s just a proton and an electron, so it’s absolutely tiny. There is almost no way to seal it perfectly, especially in gaseous form. It’s always going to leak. Even for rockets this is an issue. You can make that amount relatively small, but it pretty much always has some loss.
Caverns may make sense for large-scale solutions, because the quantity is so large compared to the loss. Most people don’t have massive caverns under their house though, nor do they have a need for that large of a quantity.
There’s a engineer that did it in his backyard. I’ll see if I can find it when I get home.
it can’t be used to create false scarcity! is isn’t massively volatile, how are the ultra wealthy going to make absurd amount of money off it?
You forgot battery storage (200 usd/kWh) and non-generation use for natgas.
Also, that’s a year for the solar panels to get 1.5 TWh but the tanker probably makes that in a month.
Their argument is per unit of cost. But natgas and electricity is not fungible. Even electricity from renewable generation is not fungible with dispatchable generation.
Well the argument was about energy cost. 1.5 TWh is 1.5 TWh, however you choose to spread it out.
You seem to be worrying about power, which is a fair but separate issue to be concerned about.
It’s important for full conversion of the grid, but for just cost of energy, it isn’t needed. While 100% of the generated energy is used during the day there’s nothing left to store. I think a lot of places are still in this situation. But yeah, the more solar you build the more important that cost becomes.
The latter will still benefit from cutting down use a lot.
Sure, the less methane burned in peaker plants and AI DC gas turbines, the better.
It is blatantly not motivated by the economy (except the few vested interests).
It is mostly about power.
Okay, waiting for economics to take over then. If the markets really do work the way economists imagine then solar will become the only viable investment and power dynamics won’t matter in the end.
Look at basically any country, and installed, in use solar capacity is substantially higher than it was 10, or even 5 years ago. Solar has driven the cost of fossil fuels lower and lower. The next hurdle is utility scale batteries, which may have already exceeded 1,000 new installations per year.
I’m solar fan #1, but 5x that price would still be a good deal on panels
Ok ok this might work but one question, can we mine solar panels out if the ground in the middle east?
The LNG also takes up 3x the volume in shipping.
Also LNG in Europe is currently over $15/mmbtu, and 55% efficiency applies only to advanced (expensive) combined cycle plants that need to run 24/7 to achieve that rate. Peaker plants are less than half as efficient.
So instead of 25-30 times more energy/$ from solar, its closer to 35-50 times, before including the cost of the power plants that burn the fuel.
only problem with me personally about this, is that i’m stuck with gasoline using car, i dont have money to buy 50k electric car :/
Ikr? I could have had $10k BYD Dolphin, but we haaaad to do the tariff wars.
I will offhandedly mention that ebikes are getting pretty good/cheap nowadays, but that’s obviously not going to work for everyone.
20k EUR would get me a Dolphin Surf over here, Dolphin is over 30k. We also have tariffs because the EU has an auto industry to protect from cars being sold under cost of manufacturing too. Dacia Spring can be had for like 15k.
It’s not a bad deal for the average person looking at a vehicle they don’t have to work on, but 2k for a used Audi gets me a significantly more comfortable car that’s also more powerful and has twice as much cargo space. I don’t even like Audi, it was just the cheapest 6 cylinder diesel wagon around with isofix at the time. Also the list price might’ve been 2k, I actually paid less because it was ugly as sin (in terms of paintwork, not the model itself).
The economics don’t work the same if you’re incapable of maintaining a 20 year old German executive car at home (which most people aren’t), but for some of us, ICE vehicles are DIRT cheap because you can get a 20 year old one that really has 90% of the tech you’d want in a car, and is missing all the stuff you don’t, parts are cheap, and doing your own work on a car is as much therapeutic as it is work. And the reason I specifically go for these vehicles is that they’re cheap because people are afraid of the complexity and unreliability, but I’m familiar with them and know how to keep them on the road indefinitely without going bankrupt.
So part of me wishes I had an EV, but the other part of me says I’d be paying 10-20X as much for a vehicle with inferior driving characteristics (I don’t mean acceleration, I mean the suspension setup in budget EVs, I have well-designed multi-link front and rear, adaptive dampers and it’s all on air springs) and less space. I’d gain a fancy touch screen, but that actively repels me.
Now I did test drive an Audi E-Tron as those are available for cheap (for a big EV SUV), but I was very disappointed with the comfort in that. Literally not comparable to my 20 year old A6 Allroad, which isn’t even most comfortable car I’ve owned. But as EVs have undergone rapid development in the last 5 or 6 years, I think that there’s finally stuff available that I’d actually like to own. In 5 more years when they’re depreciated to hell and the powertrain and battery warranty starts running out.
Cars in general are the problem and even if they all went electric they’d be bad. (But cities would be much quieter and they are hella fun to drive.)
If you’re able to use a bicycle for some of your trips instead of a car, that’s a good change. (And if you’re not then you might not even be able to use an EV car if you could afford it. It takes way longer to charge a battery than to fill a gas tank.)
But cities would be much quieter
No they wouldn’t. Most ICE cars make a “whoosh” sound, because most of their noise comes from air resistance - which EVs also have. And tires, of course.
Cities wouldn’t stink as much, though.
We got ours for 30k with 200 miles on it, retails 45k.
Dealerships hate buying these cars used because they think there isn’t a market for used ev’s, in part because they’re so expensive, anyone who wants an ev can afford to buy one new, they think the second hand market isn’t there, go in and offer to buy a used one and see what your dealer says, I bet you can get one for half that.
Also there’s some electric only second hand dealerships starting to pop up. Maybe one in your area?
Buying your cars new doesn’t help.
I don’t know anything about the situation in the US, but you get great second hand EVs for around 12.000€ here in Germany. Combustion is cheaper to buy but gets more expensive over time. It has over 250 moving parts, EVs have like 7.
problem with second hand ev is that if the battery has to be replaced, might as well just buy new car entirely
Nearly all cars I tried had SOH over 90%. The car I bought is from 2021 and has 94,9% battery health. Buy a 25€ OBD2-dongle and read it when you test-drive it. If the owner cared just a little, battery health is not a problem. Don’t let fossil disinformation scare you.
what do you mean cared a little? what affects the battery most? I live in finland and at winters it can get -30c here and only place for car i have is outside. I also worry that i myself might wear the battery down really fast due to not being able to store the car properly. I also need to occasionally do long trips and when i visit my mother, i think the closest charging spot is at least 10km away so i might get stuck easily too if i run out of battery.
I really REALLY would prefer ev, i hate having to pay stupid prices for gas, taxes and even maintenance since combustion engine wears down much faster and worse. But the reality for me is that there just isnt enough infrastructure for ev in north finland for me to use ev without having to worry more than with my current car. I guess rich people dont have any problems no matter where they are, considering how many teslas i have seen, but i’m not one of those. + i just switched my car so my funds for it are expended for forseeable future unless i get work, which in finland seems about as easy to do than winning in lottery if you are not right type of person.
Here’s a study about battery health. Bottom line is, charging from 0% to 100% gives you 500 life cycles until it’s at 70% health. Charging from 20% to 70% gives you 6.000 life cycles. That’s is a huge difference and you should keep that in mind.
I don’t know how low temperatures affect battery health. But ask around, aren’t EVs super popular in Finland?
at least cold weather drains battery, not sure how it affects the health in general but i dont think it does it any good. The people who have ev are most likely those who can also afford heated and closed space for their car. At least i have seen many teslas all around so it would make sense if there are even more evs because tesla is only car i can definitely tell is ev.
I wish evs had somekind of “emergency” battery that would charge the main battery if it gets too low so it would protect it from getting too empty.
Get one used… The batteries are good enough now that even used, they are a good investment


